Investment Styles
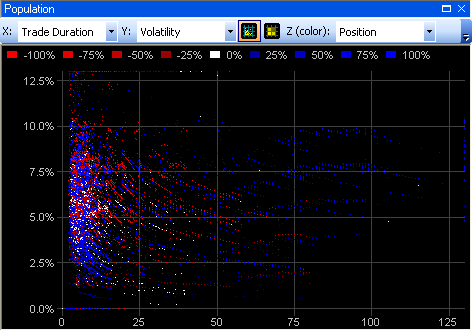
As an illustration of the variety in investment styles of agents, their wealth Volatility is plotted here on the Y-axis against their Trade Duration (average number of bars between successive transactions) on the X-axis. Each dot represents one agent.
Volatility is used here as a measure of absolute risk and thereby considered an important element of the trading/investment style of an agent.
Trade Duration is used here as a measure of the investment/trading horizon of an agent and thereby also considered an important element of the investment/trading style of an agent. Low values (to the left) indicate frequent trading while higher values (to the right) indicate less frequent trading.
The color of the dots indicates the Position an agent is holding in the security,
ranging from -100% for a short position to 100% for a long position (see legend above chart).